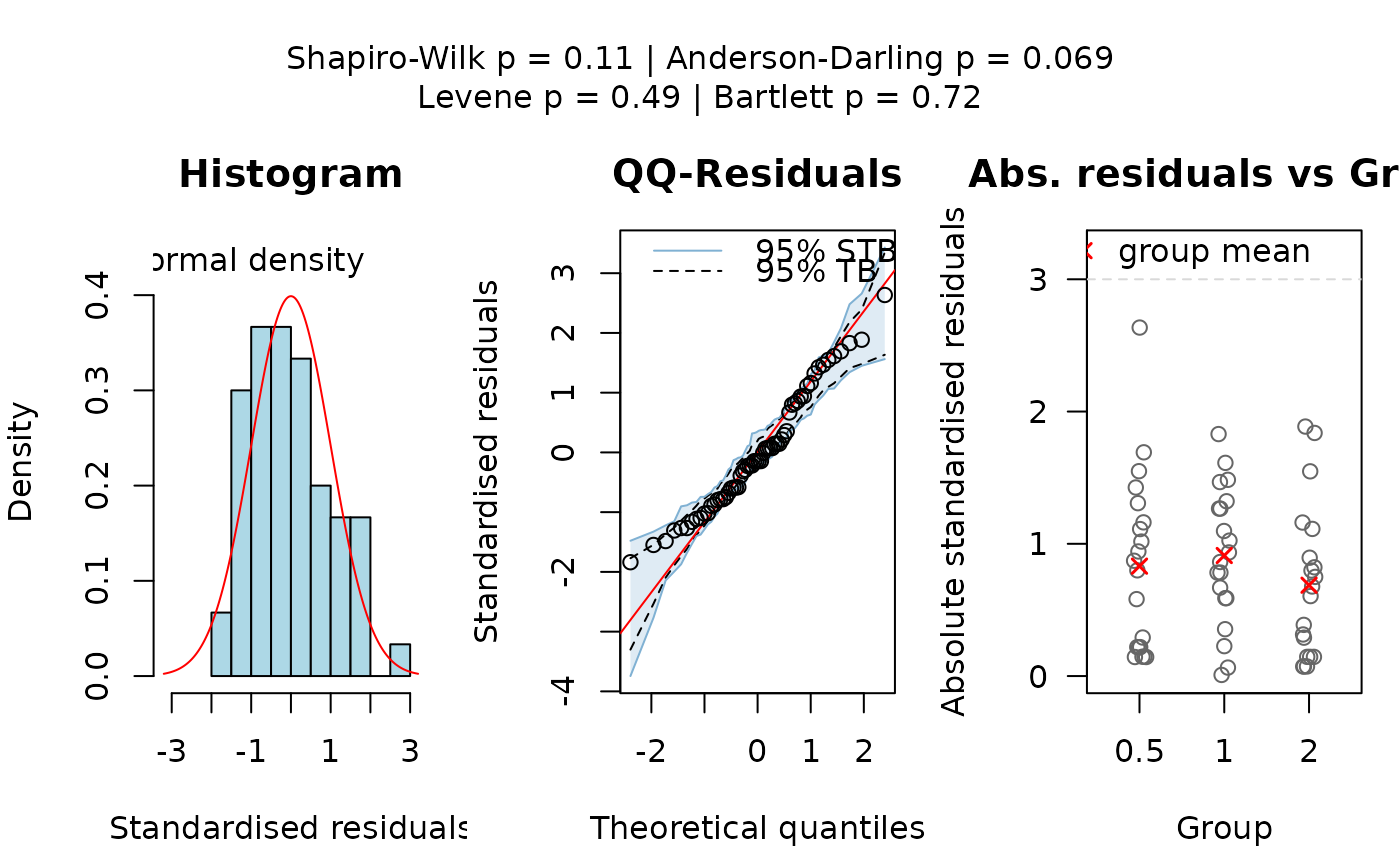
Visualisation of linear model assumption diagnostics
Source:R/vis_lm_assumptions.R
vis_lm_assumptions.RdChecks the residual diagnostics in the general linear model
Student's t-test
(t.test,var=EQUAL)
Fisher oneway ANOVA (aov) or simple linear regression.
Performs the Shapiro-Wilk and Anderson-Darling tests for normality, and
for grouped data also levene.test and Bartlett's test for
homogeneity of variances. For simple linear regression, heteroscedasticity
is assessed with bp.test, the studentised Breusch-Pagan test,
which regresses squared raw residuals on fitted values. The normality tests,
the grouped variance tests,
and the histogram and Q-Q panels are computed from the internally
studentised residuals r_i = e_i / (SE_res sqrt(1 - h_i)), which remove the
leverage-dependent variance of the raw residuals (Var(e_i) = sigma^2
(1 - h_i)). The residuals-vs-fitted panel (regression mode) uses the
z-residuals z_i = e_i / SE_res, which retain the leverage-dependent spread.
Arguments
- samples
Numeric vector; the dependent variable.
- fact
Factor; the independent variable.
- cex
Numeric; scaling factor for plot text and symbols (default: 1).
- correlation
Logical. If
FALSEandfactis numeric, regression diagnostics are shown. IfTRUE, no regression diagnostics are shown. Default isFALSE.- conf.level
Numeric confidence level for the simulated Q-Q envelopes.
- qq_nsim
Integer number of simulated refits for the Q-Q envelopes.
- plot_args
Optional named list of base graphics parameters.
Value
A list with elements:
- summary_anova
Summary of the ANOVA model.
- shapiro_test
Result from
shapiro.test().- ad_test
Result from
nortest::ad.test()or a character message if n < 7.- levene_test
Result from
levene.test()(grouped diagnostics only).- bartlett_test
Result from
bartlett.test()(grouped diagnostics only).- bp_test
Result from
bp.test()(regression diagnostics only).
Details
The Q-Q panel shows the simultaneous and point-wise tolerance bands computed
by qq_lm_envelope, which documents their construction and
gives the reference for it.
References
Schützenmeister, A., Jensen, U., & Piepho, H.-P.
(2012). Checking
Normality and Homoscedasticity in the General Linear Model Using
Diagnostic Plots. Communications in Statistics - Simulation and
Computation, 41(2). doi:10.1080/03610918.2011.582560. (Q-Q
simultaneous tolerance band, see qq_lm_envelope.)
See levene.test and bp.test for the references
of those two tests.
Examples
ToothGrowth$dose <- as.factor(ToothGrowth$dose)
vis_lm_assumptions(ToothGrowth$len, ToothGrowth$dose, qq_nsim = 100L)